
Exit polling explained
This page is designed to explain to the wider public how exit-polling works at UK General Elections nowadays (i.e., ever since 2001–2005 when the current method was developed).
The main text in the "Exit Poll Explainer" below was written in 2010. At the top, just below this caption, are brief updates added after each of the three elections that have taken place since 2010.
Ahead of the December 2019 election — where the methods described below were again used jointly by BBC, ITV and Sky — I also made this related post in my blog: Why we should trust the exit poll — but not too much!
Persistent web link for this page: warwick.ac.uk/exitpolling
Update #3 (December 2019): The methods described below were again used successfully on 12 December 2019... more
|
Update #3 (December 2019): The methods described below were again used successfully on 12 December 2019 (by the same team of academics as in 2015 and 2017, led by John Curtice and Jouni Kuha). At 10pm on election day the on-air seats prediction (simultaneously on BBC, ITV and Sky) based on the exit poll was: Con 368, Lab 191, SNP 55, LD 13, others 23. The actual result of the election was Con 365, Lab 203, SNP 48, LD 11, others 23. The 10pm prediction was (again) strikingly different from the pre-election polls, most of which had predicted a much narrower win for the Conservatives. As ever, the main focus is on how many seats will be won by the largest party in the new House of Commons. To get so close to that target, with an error of just 3 seats, is quite remarkable. Indeed, as I commented in my blog just before the 2019 election day, it is accuracy beyond what should reasonably be expected (Why we should trust the exit poll, but not too much). It's hats off, again, to John Curtice, Jouni Kuha and the rest of the team! And according to Jouni Kuha my old software, written in R ahead of the 2005 election still runs smoothly! Amazing. DF |
Update #2 (June 2017): The methods described below, which I had developed in collaboration with John Curtice at the 2001 and 2005 elections, were again used successfully on 8 June 2017... more
|
Update #2 (June 2017): The methods described below, which I had developed in collaboration with John Curtice at the 2001 and 2005 elections, were again used successfully on 8 June 2017 (by the same team of academics as in 2015: John Curtice with Jouni Kuha, Steve Fisher, Jon Mellon, Rob Ford and Patrick English). At 10pm on election day the on-air seats prediction (simultaneously on BBC, ITV and Sky) based on the exit poll was: Con 314, Lab 266, SNP 34, LD 14, others 21. The actual result of the election was Con 318, Lab 262, SNP 35, LD 12, others 22. 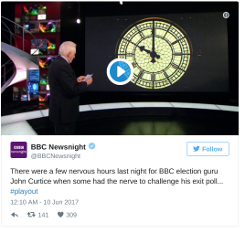 Link opens in a new window Link opens in a new windowSo, yet another stunningly accurate exit-poll prediction! The actual election result in June 2017 was so close to the exit-poll prediction that the prediction really ought to be viewed as again being "spot on". (The two earlier "exact" predictions, at the 2005 and 2010 elections, had perhaps been too accurate, in the sense that their exactness can easily give a false impression of the typical precision of the exit-poll instrument. See What's the "margin of error" in the exit poll?, below.) The prediction made at 10pm was (as it had been in 2005, 2010 and 2015 too) extremely surprising. It said that a hung parliament was the most likely outcome — a prediction that stood in contrast to most of the pre-election polling which had predicted a substantial Conservative overall majority. A remarkable aspect this time was that the exit poll's surprising prediction was not simply rubbished on TV and elsewhere by the politicians and commentators: this time there appeared to be, at last, recognition that the exit-poll methodology that has been in use since 2001 is fairly reliable. The 10pm prediction, although very surprising to most people, was taken as a clear indication that Theresa May's early-election gamble had backfired; and there were no extravagant promises made by politicians to eat their hats or run naked through the streets. (See some of the quotes below for those references, if you don't know them already!) The financial markets, too, appear to have taken the exit poll as authoritative (as indeed they had in 2015, too): see for example this article at Business Insider UKLink opens in a new window. Also pleasing to hear (via Jouni Kuha, a couple of days after the election) is that the fairly extensive computer code that I wrote back in 2005 — in R version 2.1.0, running on whatever laptop I had at that time — still runs! (With a few tweaks, no doubt.) I am definitely not a great programmer; so this is really thanks to the R Core Development TeamLink opens in a new window who have consistently made good decisions that have kept the open-source R projectLink opens in a new window stable enough and dependable enough for important long-term projects. |
On a more personal note: This election was the first time that I (David) got some public visibility through the BBC (on TV, radio and the internet) for this work. That was very welcome recognition, not least because some of it was seen by friends and family members who now can relate to at least something that I do! The short video linked below, for example, appeared on the global BBC website the day before the election, and was featured in some TV news bulletins too. Link opens in a new window Link opens in a new window |
Update #1 (May 2015): The methods described below were again used successfully on 7 May 2015... more
|
Update #1 (May 2015): The methods described below were again used successfully on 7 May 2015 (by the usual team of academics: John Curtice led as usual, this time with Jouni Kuha, Steve Fisher, Jon Mellon, Rob Ford and Patrick English). At 10pm on election day the on-air seats prediction (simultaneously on BBC, ITV and Sky) based on the exit poll was: Con 316, Lab 239, SNP 58, LD 10, others 27. The actual result of the election was Con 331, Lab 232, SNP 56, LD 8, others 23.
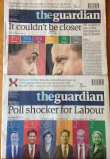
The 2015 exit-poll prediction was thus not "spot on" as it had been in 2005 and 2010. Many commentators had warned beforehand that the 2015 election would be an especially difficult one to predict. The exit-poll prediction was startlingly different from what had been indicated by commercial pre-election voting-intention polls. (e.g., see The Observer on 10 May, After the exit poll, a tsunami raged across the political map) The exit poll strongly indicated the Conservatives as largest party, and the ultimate outcome of a small Conservative majority was clearly not ruled out. This was in stark contrast to predictions from pre-election polls, which had consistently shown Conservative and Labour neck-and-neck with neither party close to an overall majority. Again there were some notable public quotes, most prominent of which came from the former Liberal Democrat leader Lord Ashdown, who was interviewed soon after 10pm on the BBC:
(He was referring to the predicted collapse of the Liberal Democrats to just 10 parliamentary seats. In the event, it turned out even worse than that for the Liberal Democrats, who won just 8 seats. Lord Ashdown failed to keep his hat-eating promise, though!) Photo by kind permission of Guardian News and Media Ltd., and Copyright © Guardian News and Media Ltd., 2015 |
The remainder of this page's content, below and on the right, was written shortly after the May 2010 General Election.
The rest of this page: An exit-poll explainer
|
|
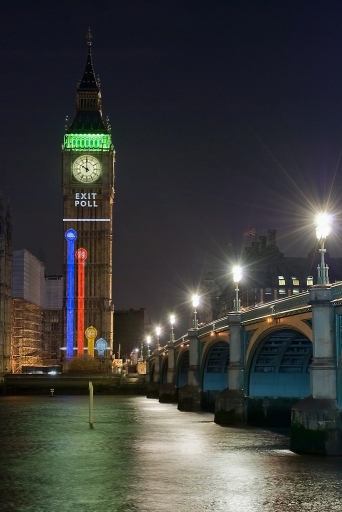
Straight after the 10pm close of polling stations on General Election day 6 May 2010, the BBC projected the exit-poll prediction onto the clock tower at Westminster. This photo was composed by Gary WhiteLink opens in a new window and it appears here with his kind permission. |
Contents of this Explainer: |
Exit polling at the UK General Election (a bit of background)
The major broadcasters BBC and ITV have commissioned exit polls at general elections for many years. In recent years new statistical methods have been introduced to improve the accuracy of prediction of House of Commons seat totals on the basis of an exit poll. The performance of the new methods has been very good. At the 2001 election, when those methods were used (in prototype form, being only partially developed at that stage) for the first time by the BBC, the size of the Labour majority was predicted at 10pm on polling day with an error of just 6 seats; and at the 2005 and 2010 elections the number of seats for the largest party was predicted with no error at all!
The 2010 exit poll (commissioned jointly by BBC, ITV and Sky) |
||||
| Con | Lab | LD | Other | |
| Prediction at 10pm: | 307 | 255 | 59 | 29 |
| Actual seats won: | 307 | 258 | 57 | 28 |
Prior to 2001 the methods used had been different, and the accuracy of predictions based on exit polls was rather variable — sometimes good, sometimes poor. Perhaps the most famous failure was in 1992, when the forecasts made by both BBC and ITV based on separate exit polls were that the Conservatives would only just get more seats than Labour, resulting in a predicted hung parliament. It turned out that the Conservatives had actually done much better than that in the 1992 election, winning 65 more seats than Labour and achieving a parliamentary majority of 21 seats.
The recent history of UK exit polls: Error of the 10pm prediction of the winning party's House of Commons majority |
||
| BBC | ITV | |
| 1992 | 62 | 70 |
| 1997 | 29 | 21 |
| 2001 | 6 | 10 |
| 2005 | 0 | |
| 2010 | 0 | |
| Figures highlighted in bold are for the new methods, used by BBC in 2001 and by BBC and ITV jointly in 2005 and 2010. (Source for the figures up to 2001: Payne, 2003 |
||
Main ingredients of the current method
This is the main point of this web page: to explain what's important to the success of the new approach.
The key ingredients are:
- The results of previous elections
- Local-level data from previous exit polls
- Careful planning and execution of the exit poll itself
- Measurement of electoral change in a multi-party contest
- Statistical modelling
- Probability, not certainty
- Luck!
Most important of all: The team of analystsWhereas the fieldwork (i.e., interviews with voters, etc.) for the exit poll is carried out by major polling companies, the analysis and the predictions made are the work of a small team of academic researchers. On the election day itself, the emphasis is on finding good statistical models for the exit-poll data. For this to be successful, especially in the very limited time available, the ideal team combines high-level skills and experience in both statistics and political science. This is not something that could ever be handed over to a computer!
At the 2001, 2005 and 2010 elections the analysis team included: John CurticeLink opens in a new window (University of Strathclyde, Dept of Government), David FirthLink opens in a new window (University of Warwick, Dept of Statistics), Steve FisherLink opens in a new window (University of Oxford, Dept of Sociology), Jouni KuhaLink opens in a new window (LSE, Dept of Statistics), Clive PayneLink opens in a new window (Nuffield College Oxford) and Neil ShephardLink opens in a new window (University of Oxford, Dept of Economics). |


Ingredient 1: The results of previous elections
Some motivation:
- The people who vote at successive elections are mostly the same people.
- Most people's political views and party allegiances are fairly constant.
- The "margin of error" attached to declared election results is essentially zero (putting aside the possibility of a mis-counted vote here and there). Election results are the surest possible reflection of political opinion.
- Each member of the House of Commons is elected by a local constituency. Previous election results tell us more about voting behaviour at constituency level than any realistic amount of pre-election polling possibly could.
Taken together, these points compel us to make good use of previous election results at constituency level if we want to make accurate predictions. (This should seem obvious!)
The essence of the exit-poll prediction methodology is therefore to estimate the likely changes in voting behaviour in every constituency, and then apply the estimated changes to the previous election results.
Ingredient 2: Local-level data from previous exit polls
Exit polling can only take place where most people vote, i.e., at polling stations. To measure changes in voting behaviour (since the previous general election) reasonably accurately with an exit poll, it is most helpful to be able to compare directly with the results of previous exit polling at the same locations. The main reasons for this are:
- In the UK, each constituency has many polling stations at different locations, but the votes are all counted centrally within the constituency: there are no vote counts made for individual polling stations.
- Within a constituency, there can be very wide socio-economic variation between the electorates registered to vote at different polling stations. Previous election results for the constituency therefore tell us little about how a particular polling station might have voted.
In other electoral systems where vote counts are made and published for each individual polling place (as they are, for example, at elections held in the USA and elsewhere), there would clearly be less need for previous exit-poll data at the same locations. The UK setup thus makes exit polling particularly difficult. However, there is a silver lining here: comparing directly with a previous exit poll to measure change allows at least the hope that any serious exit-poll biases (arising from such sources as differential patterns of refusal or of postal voting) would be present on both occasions and so might largely cancel out.
Ingredient 3: Careful planning and execution of the exit poll
For the reasons just mentioned, ideally the exit poll would simply re-visit those locations that were exit-polled at the previous election. But in practice there are always reasons why some polling stations in the exit-poll panel have to be replaced by new ones. The reasons include:
- large changes in the electorate for a polling station
- likely un-representativeness of a polling station (this would apply, for example, to polling stations in the constituency held by the Speaker of the House of Commons, whose seat is traditionally not contested by the major parties)
- changes to the physical layout or location of a polling station which might make exit polling difficult or dangerous
- the need for the exit poll to include polling stations in constituencies representing potentially important types of electoral contest
- etc., etc.
Much of the essential preparatory work, and all of the interviewing on election day itself, is expertly handled by large, experienced polling companies (in recent years the BBC and ITV have relied on NOP and MORI for this). Their care and expertise in obtaining responses from electors and delivering high-quality data is crucial to the success of the whole enterprise.
Ingredient 4: Measurement of electoral change in a multi-party contest
With just two parties in contention, the familiar notion of two-party swing is extremely useful. However, with 3 or more parties there is a difficulty: for example, the swing from Lab to Con and the swing from Lab to LibDem are inevitably related to one another.
There is no single "best" resolution of this problem: there are many possibilities, and the choice among them is arbitrary. The measures of change that have been used for exit polls since 2001 are (in the case of a 3-party contest between Con, Lab and LibDem):
- Change in the LibDem share of the 3-party vote
- Change in the Lab share of the votes for Lab and Con (i.e., change in "Lab share of the 2-party vote")
These measures are at least not logically related — they can vary independently of one another. They are also fairly straightforward to interpret (the second one is the basis of Steed swing, which has been quite widely used for many years).
With more than 3 parties in contention, the above scheme extends in an obvious way. For example in Scotland, where the nationalist party SNP is a contender, the change in "SNP share of the 4-party vote" is used in addition to the 3-party measures just described.
Ingredient 5: Statistical modelling
What the exit poll directly provides are estimates of multi-party electoral change, for each of the (100 or so) polling stations visited on election day. In order to produce a House of Commons seats forecast, though, what's needed is an estimate of multi-party change for each of the (600-odd) parliamentary constituencies.
The means of getting from the former to the latter estimates is a statistical model. In essence, the statistical modelling exercise is to identify (from the exit poll data) types of constituency within which electoral change is expected to be roughly the same. The aim is to use other data that's available at constituency level (such as previous election results, geographical data, census data, etc.) to "explain" — as simply as possible, using the widely used statistical method of regression modelling — whatever patterns of varying electoral change become apparent in the exit poll data.
An example:It might appear from the exit-poll data that there are two distinct types of constituency, say
with rather different patterns of electoral change. A statistical model based on this finding would then, in essence,
to produce estimates of change that can be applied to each rural constituency and to each urban or suburban constituency (thereby producing predicted party vote shares in all constituencies). |
The number of constituency-level variables (such as rural/suburban/urban) that are available is huge. Arriving at a good statistical model is something of an art, but it is what professional statisticians are trained to do! This part of the work on election day is crucial to accurate prediction, and it demands the careful and imaginative work of statisticians working alongside knowledgeable political scientists.
It's important to recognise that any prediction made from a poll is based on a statistical model, even the simplest kind of "uniform swing"-based prediction (wherein the statistical model is that the change in all constituencies is essentially the same, i.e., no differently-behaving "types" of constituency need to be distinguished). Once this is recognised, the task becomes that of finding a good statistical model, which captures the most important sources of variation in electoral change.
Ingredient 6: Probability, not certainty
From a suitably constructed statistical model, the required estimates of changes in party vote shares are obtained for every constituency. These estimated changes are then applied to the known results of the previous election, constituency by constituency, to produce estimated party vote shares at the current election.
The important word here is estimated: on the basis of just an exit poll, nothing is known with certainty! In particular, the exit poll does not tell us which party will win any given seat; but it can tell us how likely each party is to win a given seat.
An example:From the statistical model that was used on 5 May 2005 to produce the 10pm exit-poll-based seats prediction, the estimated vote shares (%) in the Ribble South constituency were as follows:
But this does not mean that, when counting up the predicted seat totals for the main parties, we should count Ribble South as a win for Labour! The estimated vote share for the Conservative party was also large in Ribble South, and clearly they had a chance of gaining that seat from Labour. This is quantified by the corresponding win probabilities for each party in Ribble South:
On the basis of the estimated vote shares, then, Labour is given a 73% chance of winning the Ribble South seat, and the Conservatives a 27% chance. The win-probabilities for other parties were negligible. Note that the "0.00" probability here for the Liberal Democrats is not actually zero — it was not known at 10pm on election day how people had voted in Ribble South, so the possibility of a LibDem win could not be completely ruled out — but it is smaller than 0.005, i.e., less than a chance of one in two hundred. (When the result for Ribble South was declared on 6 May 2005, it emerged that Labour had won that seat.) |
Once the win-probabilities for each constituency have been obtained, it is a simple matter to calculate the expected number of seats that a party will win: just add up all of that party's win-probabilities across different constituencies.
For example, in 2005 the Labour party's win-probabilities — which included the 0.73 chance in Ribble South — summed to 356 (after rounding to the nearest whole number); since the House of Commons in 2005 had 646 seats, that equates to a predicted majority of two times the difference between 356 and 646/2, i.e., a majority of 66 seats for Labour. (That, then, was the 10pm forecast given by the major broadcasters; it was a much smaller majority for Labour than the 100+ that had been suggested by pre-election voting intention polls, but 66 turned out to be exactly right!)
The final ingredient: Luck!
The exit poll is based on a fairly small sample (100–200) of voters at each of a fairly small number (100-odd, out of 40,000 in all) of polling stations. There is always a risk that either the polling stations selected, or the particular voters who respond to the exit poll, will turn out to be untypical — in regard to their vote-changing since the previous election — of other voters or other polling stations. To some extent this can happen purely by chance, or "bad luck".
The statistical approach outlined above is carefully designed to minimise the impact of an unrepresentative sample, but the risk of a "bad" sample can never be completely eliminated. A reasonable question, then, is "How accurate should we expect predictions based on an exit poll to be?". This is a hard question to answer precisely. Roughly speaking, though, based on past experience:
- A House of Commons majority prediction that is within 20 seats of the actual outcome is a reasonable aspiration from a well-conducted exit poll.
- Getting the House of Commons majority right to within 10 seats should be regarded as an exceptionally accurate prediction.
- Predicting the size of the largest party in the House of Commons exactly is highly unlikely — but, as evidenced by the results in 2005 and 2010, even such unlikely events do happen sometimes!
Frequently asked questions
Brief answers are given here to some of the more commonly asked questions about electoral exit polling.
What is an exit poll?
An exit poll is a sample survey of people who have just voted at a polling station. Statistical sampling methods are used to determine which voters to interview. The main point of the "interview" is to ask the voter to complete a duplicate ballot paper.
Exit polls differ fundamentally from pre-election polls (voting intention polls, or opinion polls) in that only people who actually vote are included in the sample. (In the UK, where General Election turnout is typically only a little over 60%, this matters!)
Why bother with an exit poll?
Why not just wait for the election results? A clear reason is that TV, radio and internet coverage on election night gives cultural unity to the whole UK for the hours from 10pm, and so the broadcasters have a duty to provide information of the highest quality possible during those hours. The exit poll not only provides a strong clue at 10pm of the likely eventual outcome, to inform on-air discussion by politicians etc.; more crucially, in the following hours it provides the necessary context in which to interpret the live declarations of constituency results.
Does the exit poll assume uniform swing?
No. Variation (from constituency to constituency) in electoral change is explicitly accounted for in the analysis of the exit poll data, and in the probabilistic predictions made.
Does the exit poll predict every seat?
Not quite. Some parliamentary constituencies are "special", in the sense that they clearly cannot be expected to follow identified national patterns of vote-changing. Prime examples of such "special" seats are constituencies in Northern Ireland and the seat held by the Speaker of the House of Commons, which the main political parties do not contest. The predictions made for this relatively small number of "special" seats do not use the results of the exit poll.
What's the "margin of error" in the exit poll?
Roughly speaking, the predicted House of Commons majority from a well-run exit poll might be expected to be within about 20 seats of the actual majority. (See luck, above.)
Can the exit poll predict national vote shares?
Yes. The statistical model for the exit poll provides predicted shares of the vote for each major party in every constituency (well, nearly every one — see Does the exit poll predict every seat?). The only extra thing needed for a prediction of national vote shares is an assumption about variation (between constituencies) in voter turnout. The simplest assumption to make is that any change in turnout since the previous election applies equally to all constituencies (and, in fact, it does not matter enormously if the assumption made here is a bit inaccurate). This assumption made about turnout, combined with knowledge of constituency electorate sizes, allows straightforward prediction of the number of votes for each party in each constituency, and hence of the national percentages for each party.
At the 2005 election, for example, the exit-poll-predicted vote percentages (across all constituencies in Great Britain, i.e., excluding Northern Ireland) were as shown in the following table:
| Con | Lab | LD | Other | |
| Prediction at 10pm: | 33 | 37 | 22 | 8 |
| Actual party vote shares: | 33.2 | 36.2 | 22.6 | 7.9 |
|
The predicted shares here are as presented by the broadcasters, i.e., rounded to the nearest percentage point. |
||||
At the 2010 election the broadcasters did not use this feature of their exit poll, at least not explicitly in their on-air presentation. In the context of a UK General Election, where there is inevitably a great deal of tactical voting, party shares of the national vote are of no real significance: what matters is the composition of the House of Commons.
What about sampled voters who refuse, or who lie?
This is potentially a major concern for the accuracy of predictions made from an exit poll. Thankfully, the majority of voters seem happy to participate in an exit poll and to respond faithfully. But this could change, and there is clear scope for further work on this aspect of exit polling.
The use of previous exit-poll data (as described above) does at least provide some hope that the possibility of serious bias from such sources, if such bias does not change substantially between successive elections, might be largely eliminated by the differencing that is carried out.
What about postal voting?
People who vote by post are not included in exit polls. This is potentially a source of bias, if the pattern of vote-changing among postal voters differs appreciably from the vote-changing behaviour of those who use a polling station. This does not seem to have been a major problem yet for prediction from exit polls, but if registration to vote by post continues to increase it could become so. For a bit more detail on how postal voting is accounted for, see Sec 2.2 of Curtice and Firth (2008).
Please send error reports or other comments on what appears here to the page contact, David Firth.
For some info on my own (DF) involvement in election-day exit polls, please see this short thread on Twitter.
The definitive (academic) account of the methods
The statistical methods used since 2001 are described in full technical detail in a peer-reviewed research paper that was discussed at the Royal Statistical Society in 2007 and published (with a written account of the discussion) in 2008:
| Curtice, J and Firth, D (2008). Exit polling in a cold climate: The BBC/ITV experience in Britain in 2005. Journal of the Royal Statistical Society A, 171, 509–539 |
If you want to mention the new methods in something you're writing, that's the appropriate source to cite. But it's not light reading! It is written mainly for professional statisticians and political scientists who have substantial training in statistical methods. The aim of this web page, then, is to explain the main ideas in a less "academic" way.
June 2011 update
There's now a published account of the May 2010 experience:
| Curtice, J, Fisher, S D and Kuha, J (2011). Confounding the Commentators: How the 2010 Exit Poll Got it (More or Less) Right. Journal of Elections, Public Opinion & Parties A, 21, 211–235 |
August 2017 update
There's now a published account of the June 2017 experience:
| Curtice, J, Fisher, S, Kuha, J and Mellon, J (2017). Surprise, surprise! (again): The 2017 British general election exit poll. Significance, 14(4), 26–29 |
Quotes from May 2010:
Chris Giles, Financial Times, 2010-05-06: "Getting the result spot on at 10pm will be quite a challenge tonight"
Alex Barker, Financial Times Westminster Blog, 2010-05-06: "The joint BBC/ITV exit poll correctly predicted the 66 seat majority in 2005. Don’t expect it to be as accurate tonight."
David Dimbleby, BBC TV, 2010-05-06 (just after he announced the exit poll prediction at 10pm): "If that's right the Liberal Democrats despite all that noise and fury have actually dropped 3 seats, which could be one reason why we need to be sceptical about this exit poll."
John Rentoul, The Independent on Sunday, 2010-05-09: "The accurate prediction was so shocking, at 10pm on Thursday, that large numbers of Conservatives flooded the internet to scorn it as utterly implausible and to say that it could not possibly be right because it failed to accord with what they felt in their bones. Most incautious was Iain Dale, Tory blogger and would-be candidate, who said: 'It seems too incredible to be true that the Lib Dems are only predicted to get 59 seats. I'll run naked down Whitehall if that turns out to be true.' In the end, of course, the Lib Dems won even fewer seats, 57. Dale's streak is eagerly awaited."