Greg McInerny (Associate Professor)
Greg McInerny (Associate Professor)
My research focuses on Data/Information Visualisation, an area that bursts out of the confines of data science and design, bringing software and sciences into relation with the arts, humanities and social sciences. Humans are predisposed to making sense of visualisations, unlike other forms of data and models, as we pre-attentively process graphical objects whether or not we fully comprehend what is being seen. As such, I am interested in visualisations which visualise, and very interested in those that don’t.
As visualisation is so interdisciplinary, this topic offers many opportunities to reflect on interdisciplinarity itself, such as through the disciplinary tensions that arise in visualisation scholarship, as well as in visualisation software and its use (s). In the long term, I hope to contribute to a more holistic, 20/20 vision of visualisation.
My research works with 'visualisation' in four ways: 1) using visualisation as a research method, 2) visualisation design techniques and tools, 3) critical visualisation Studies, and 4) understanding visualisation in the real world. In combination, these sub topics offer a way into understanding ‘visualisation’ as a subject, as a set of methods and as an object, and through a variety of frames as user, tool designer/developer and critical researcher, and through understanding everyday relationships with visualisation.
Academic Profile
I joined CIM in September 2015, having worked on the EPSRC funded 2020science projectLink opens in a new window at the University of Oxford (2012-2015) and worked at Microsoft Research Cambridge (2008-2012). Before completing my PhD in Ecology and Evolution (University of Leeds), I studied Ecology at UEA, where I carried out my dissertation at the Royal Botanic Gardens, Kew. I was a member of the Natural England Scientific Advisory Committee (NESAC), a Turing Fellow (https://www.turing.ac.uk/) and contributed to the NERC- BESS consortium as a communication advisor. My Visualisation work with Stef Posavec has been shown at MOMA (the Museum of Modern Art, New York).
R packages
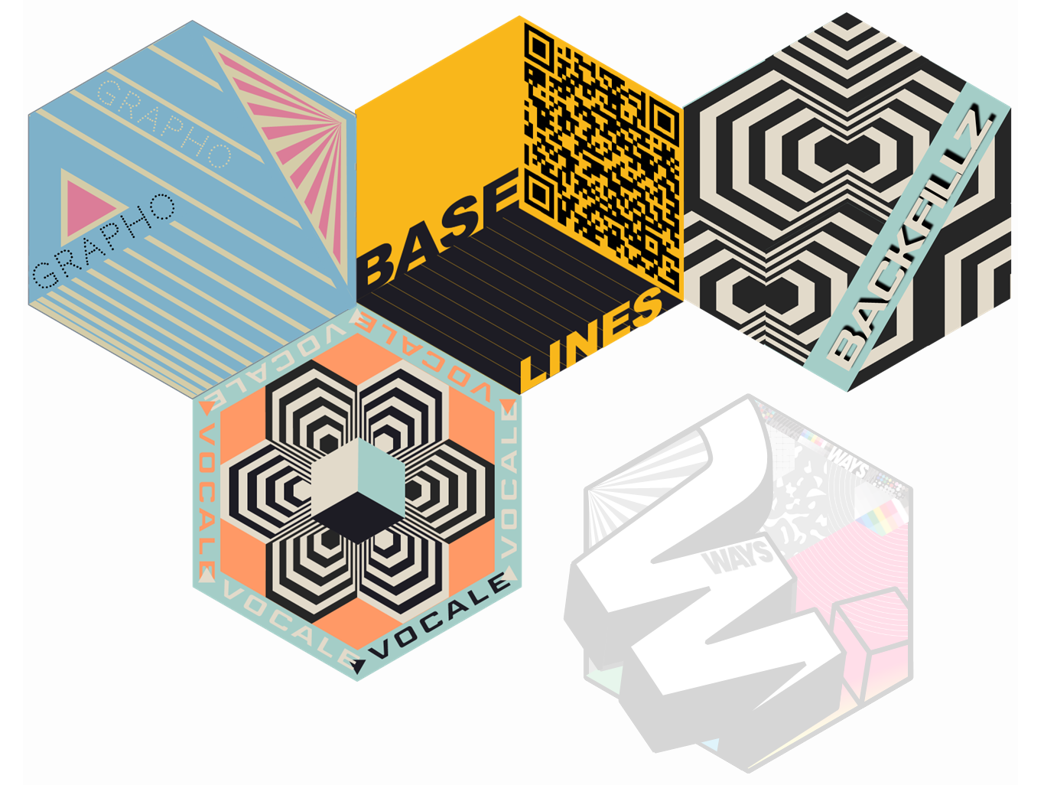
vocale - Visually Organised Cheat-sheets As Literal Explanations - https://github.com/GregMci/vocale
baselines - a drawing tool box and overlay, visual guides for R graphics - https://github.com/GregMci/baselines
with James Tripp:
grapho – automatic archiving of R graphics and code - https://github.com/jamestripp/grapho
backfillz – visual diagnostics for mcmc - https://github.com/WarwickCIM/backfillz
Recent Projects
DECIDE: Delivering Enhanced Biodiversity Information with Adaptive Citizen Science and Intelligent Digital Engagements (NERC) w/ C Turkay (Warwick), CEH (Centre for Ecology and Hydrology), University of York, Open University, JNCC, Butterfly Conservation, North & East Yorkshire Environmental Records Centre, and Greenspace Information for Greater London - https://www.ceh.ac.uk/our-science/projects/decide https://decide.ceh.ac.uk/opts/scoremap
WAYS - What Aren't You Seeing? (funded via the Alan Turing Institute ) w/ J Tripp https://www.turing.ac.uk/research/research-projects/ways-what-arent-you-seeing
BackFillz - Visual Diagnostics for MCMC (funded via the Alan Turing Institute) w/ J Tripp - https://github.com/WarwickCIM/backfillz https://www.turing.ac.uk/research/research-projects/visual-diagnostics-markov-chain-monte-carlo-mcmc
Creating Interfaces - Integrated governance at the Food-Water-Energy-nexus (Belmont Forum - EPSRC/AHRC UK Funders) - https://creatinginterfaces.eifer.kit.edu/
Swarm Intelligence: insects, humans and information on the move (AHRC funded) w/ R Fletcher, K Brown & A Thomson. https://museum.wales/blog/2019-04-26/Locust-War---A-new-display-in-our-InSight-Gallery/ https://warwick.ac.uk/fac/arts/history/ghcc/research/deserts/
ZOÖN – an R framework and online repository for Species Distribution Modelling (funded via 2020science, EPSRC) w/ N Golding, E Van Loon, D Gavaghan, T Lucas, T August. https://cran.r-project.org/web/packages/zoon/index.html https://besjournals.onlinelibrary.wiley.com/doi/full/10.1111/2041-210X.12858
Information Visualisation for Science and PolicyLink opens in a new window - Tansley Working Group (NERC Funded, 2013-2015) w/ O Gaffney, M Chen, D Young, J Dykes.
Selected Publications
McInerny, G J. (2018). 12 - Visualising Data - a view from design space. Routledge Handbook of Interdisciplinary Methods. pp, 133-141.
Golding, N., August, TA., Lucas, TCD., Gavaghan, DJ., van Loon, EE & McInerny, GJ. (2017). The zoon R package for reproducible and shareable species distribution modelling. Methods in Ecology & Evolution. 9:260–268.
McInerny, G J. & Krzywinski M. (2015) Points of View: Ranges & Scales. Nature Methods. 12(7), 591.
McInerny, G J. Chen, M. Freeman, R. Gavaghan, D. Meyer, M. Rowland, F. Spiegelhalter, D. Stefaner, M. Tessarolo, G. & Hortal, J. (2014) Information visualization in science and policy - engaging users & communicating bias. Trends in Ecology & Evolution. 29. 148-157.
Joppa, L. McInerny, G J. Salido, L. O’Hara, K. Harper, R. Takeda, K. & Emmott, S. (2013) Troubling trends in scientific software use. Science. 340(6134), 814-815.
McInerny, G J. & Etienne, R S. (2012). Ditch the Niche - is the Niche a useful concept in ecology or species distribution modelling? Journal of Biogeography, 39, 2096-2102.
McInerny, G J. & Purves, D W. (2011) Fine scale environmental variation in species distribution models: regression dilution, latent variables and neighbourly advice. Methods in Ecology & Evolution. 2(3), 248-257.
McInerny, G J. Turner, J R G. Wong, H Y. Travis, J M J. & Benton, T G. (2009) How range shifts induced by climate change affect neutral evolution. Proceedings of the Royal Society B. 276, 1527-1534.
All Publications
List of publications on Google ScholarLink opens in a new window

Contact
Centre for Interdisciplinary Methodologies
Room B0.13
University of Warwick
Coventry
CV4 7AL
Email:G dot McInerny at warwick dot ac dot uk
Tel: +44 (0)2476 574710
Teaching...
IM942 Visualisation Foundations
IM946 Advanced Visualisation Design Labs
IM945 Final Project (Practical)
CIM Blogs...
Where do we go from here? Lines of sight in the Digital Humanities (and Computational Sciences)
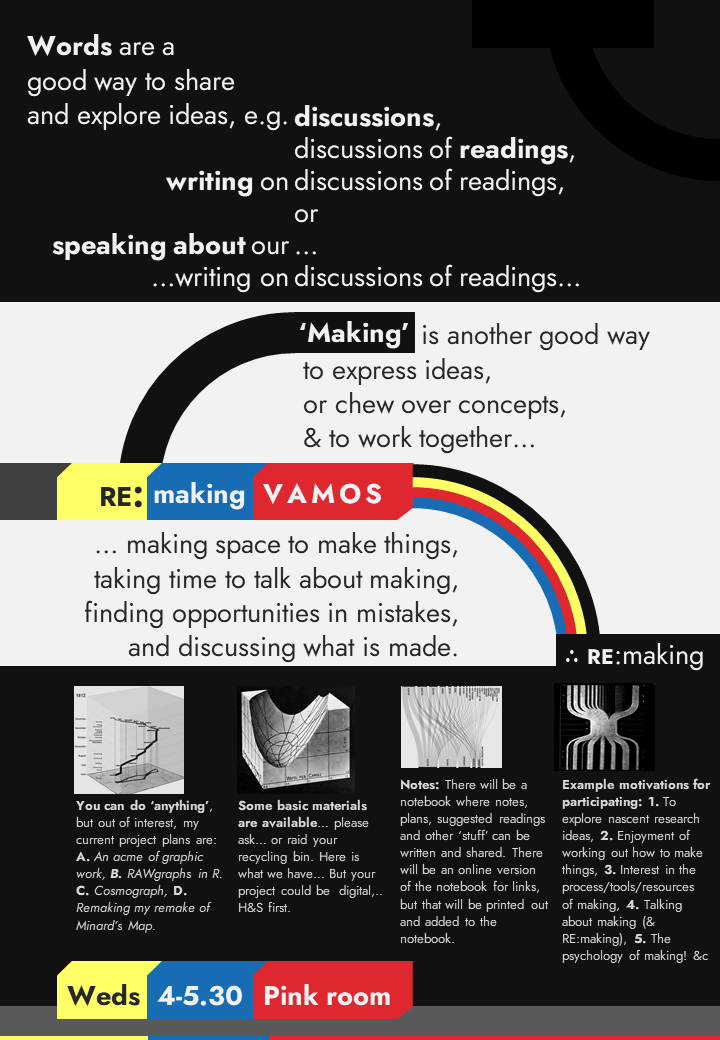
VAMOS Reading Group (Visualisation-Analytics-Mapping-Openess- Social )