
Functional Data Analysis and Acoustics
Ferraty and Vieu provide the following definition: "A random variable x is called functional variable if it takes values in an infinite dimensional space (or functional space)"[1]; these sort of rich data constitute the basis for what one scholar described as "multivariate analysis on steroids" and what most mainstream Statistics textbook present as "Functional Data Analysis".
Specifically to the area of Acoustics, the seminal work for the application of FDA (Functional Data Analysis) was that of Ramsey et al. where X, Y and Z coordinates of lip motion where used in order to infer basic principals of lip coordination [2] (The take-home linguistic message of this work being that "analyses of acceleration were especially helpful in suggesting possible (lip motion) control mechanisms").
Given the high rate of data collection and smoothing/interpolation techniques available, functional representations of a finite vector set of observations can "easily" yield, F0, the Fundamental Frequency that in physiological terms expresses how fast a person's vocal cords vibrate, being no exception. In our current work, the F0 curves produced by speaker utterances are assumed to be of functional data form. Moreover, it is natural to assume that F0 utterances can be possibly interpreted as a functional data as the articulation process itself can be viewed as a continuous process without significant loss of generality.
A more rigorous idea about the nature of Functional Data is that given an n-by-p matrix A representing a set of n observations; matrix A provides a mapping between the p-dimensional Subject space E and n-dimensional Variable (Time) space F [4]. As the dimensionality of the E becomes infinite, we move from the idea of having a p-dimensional vector of variables to having a continuum, which can be treated as t (Time); thus our data getting the form of trajectories over time. Hence, we assume that the mapping A is between two spaces of smooth vector-valued functions. Using time is not the only natural "continuum representation" available, "spatial continuums" have been utilized in other works.
When using Functional Data the choice of function space is of obvious importance [3]. In our case the dataset is considered to lay on the L2(0,1). That suffices our smoothness assumptions but also provides an analogy to the notion of Vowel Time; a relative measurement in (0,1) that represents the time-duration of a vowel's phonation. Furthermore, assuming that the functions have finite norms and that these function norms are their respective inner product with themselves, requiring a finite integral of their squares' is a natural consequence.
...
Dive into the beautiful realm of Covariances....
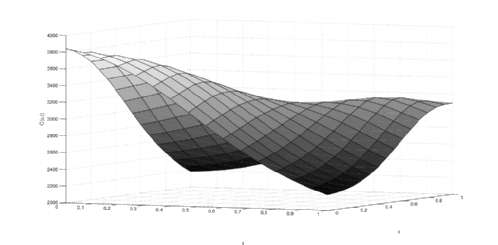
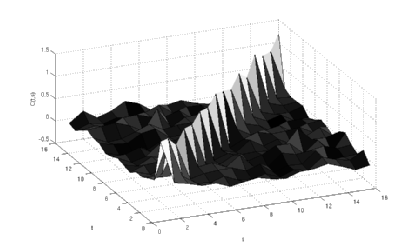
That you hope that look nice and smooth as in the first picture and not a total mess as in the second one.
- Nonparametric Functional Data Analysis: Theory and Practice, Ferraty F. and Vieu P. (2006). Springer Series in Statistics
- Functional data analysis of lip motion, Ramsay, J. O., Munhall, K. G., Gracco, V. L. and Ostry, D. J. (1996) . Journal of the Acoustical Society of America
- Some Tools for Functional Data Analysis, Ramsay, J. O. and Dalzell C.J. (1991). Journal of the Royal Statistical Society. Series B (Methodological)
- When the data are functions, Ramsay, J.O. (1982). Psychometrika << If you have to read only one (accessible) paper on this subject...