
Acoustic cargo screening
Introduction
There is a great demand from the UK and other national border control agencies for systems to screen the contents of lorries, both to prevent illegal entrance by persons and importation of prohibited or restricted materials hidden within the cargo.
We have undertaken a feasability study into the use of acoustic signals for cargo screening. This work, funded as a feasibility study by EPSRC, has been performed in collaboration with colleagues at the British Geological Survey (Prof Peter Jackson and Dr David Gunn), and Prof Zimmerman of King's College, London. There are numerous potential benefits of such a system over existing techniques. It does not use ionising radiation so is safe for operators , drivers and any illegal immigrants contained within the load. The hardware costs are relatively low and as the system is non-contact this would allow cargoes to pass through continuously at a speeds of a few m/s.
Acoustic data could be used to identify resonances within received signals caused by intra-compartmental reverberation, as shown schematically in Fig. 1(a); alternatively, the total wave-propagation time through the cargo-container of the solid and void elements comprising the cargo within the trailer-container could be measured. Both types of data could form the basis for acoustic tomography of the cargo-container (e.g. the frequency of resonance could be the variable in an image reconstruction). This would be achieved using a scanning system to collect data from acoustic transmission paths through the object, as shown schematically in Fig. 1(b). One major advantage that these methods offer over existing technology is that they would be cheap to manufacture and present little hazard to human health, being non-radiological and non-ionising. Another important advantage is that owing to the differences in the speed of sound through different solid metals, it may be possible to distinguish nuclear material from other dense metals in the instance of their camouflaged transportation in clandestine shipments.
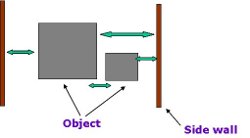
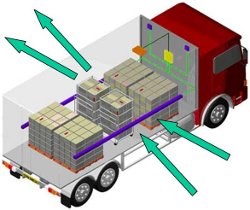
Fig. 1 (a) The concept of resonance to determine location and size of cargo items. (b) One way in which acoustic data could be collected for tomographic reconstruction.
Experimental results
The basic instrumentation setup is shown schematically in fig. 2. For experiments at higher frequencies (2 kHz- 40kHz) a ribbon tweeter was used, for lower frequencies a conventional loudspeaker cone was used. A wooden box with PVC canvas sides (as used on curtain sided lorries) was constructed to act as a scale model for the majority of tests. For larger scale tests a Quad electrostatic speaker was used as the source through larger suspended sheets to simulate the lorry sides. There are a number of challenges to implementing a system, not least that due to the large acoustic impedance mismatch between air and the materials most of the signal is reflected at first sidewall, what emerges through the other side of the model only a fraction is the direct signal with the remainder due to multiple reflections within the model.
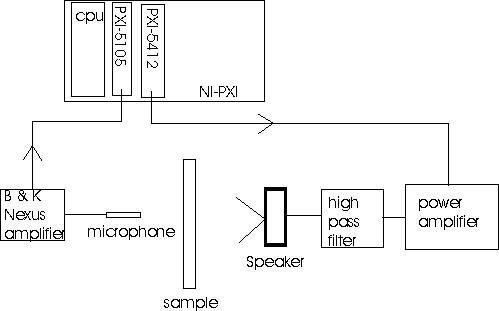
Fig. 2 Schematic of equipment setup
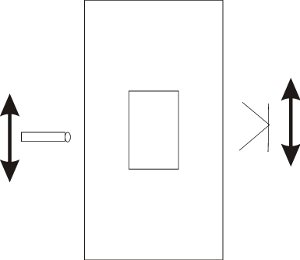
A number of different signals have been investigated including linear frequency swept chirps, stepped chirps and ladder chirps along with pulse compression and time reversal to enhance the sensitivity of the system. Figure 3 shows the results of a rudimentary linear scan across the side of the model with a sample load, plotting the amplitude of the recieved signal at a selected frequency for a conventional speaker driven with a linear chirp.
 (a)
(a)  (b)
(b)
Fig 3: (a)Schematic of scan configuration and (b) plot of signal amplitude @ 860 hz with postion with and without load in the model
Figure 4a shows the frequency spectra of the recieved signals using the Quad electrostatic speaker driven with a zero phase ladder chirp with and without a large box between the two walls, many of the features in the spectra are due to the effect of the room rather than the response of the speaker and microphone this obscures the variations we are looking for. In figure 4b the corresponding spectra after 3 iterations of time reversal and retransmission of the recieved signal are shown. In the results shown only a high pass filter, to avoid overdriving the speakers at very low frequencies has been applied to the signal before retransmision. By using a more complex filter it should be possible to enhance some of the features at the higher frequency range.
 (a)
(a)  (b)
(b)
Fig 4: (a) Recieved spectra for zero phase ladder chirp with and without box and (b) after 3 time reversals