
Statistical nonParametric Mapping - Manual
|
|
SnPM13 Manual |

SnPM: Statistical nonParametric Mapping
The Statistical nonParametric Mapping toolbox provides an extensible framework for voxel level non-parametric permutation/randomisation tests of functional Neuroimaging experiments with independent observations. The SnPM toolbox provides an alternative to the Statistics section of SPM. SnPM uses the General Linear Model to construct pseudo t-statistic images, which are then assessed for significance using a standard non-parametric multiple comparisons procedure based on randomisation/permutation testing. It is most suitable for single subject PET/SPECT analyses, or designs with low degrees of freedom available for variance estimation. In these situations the freedom to use weighted locally pooled variance estimates, or variance smoothing, makes the non-parametric approach considerably more powerful than conventional parametric approaches, as are implemented in SPM. Further, the non-parametric approach is always valid, given only minimal assumptions.
Because the appropriate permutations of the data labellings is highly dependent on the experimental design, different designs must be treated individually. This is handled within SnPM using a PlugIn architecture for "design modules". Currently, PlugIn modules are available for:
- SingleSub: Two Sample T test; 2 conditions, replications
- SingleSub: Simple Regression (correlation); single covariate of interest
- MultiSub: One Sample T test on diffs/contrasts; 1 condition, 1 scan per subject
- MultiSub: Simple Regression (correlation); single covariate of interest, 1 scan per subject
- MultiSub: Paired T test; 2 conditions, 1 scan per condition
- MultiSub: Within Subject ANOVA; multiple scans/subject
- 2 Groups: Test diff of response; 2 conditions, 1 scan per condition
- 2 Groups: Two Sample T test; 1 scan per subject
- >2 Groups: Between Group ANOVA; 1 scan per subject
The approach is described in full in Holmes (1994); Holmes (1996) and Nichols & Holmes (2001). (See references below.) These pages give a brief overview of the methodology, and describe the software, it's installation and use.
Statistical nonParametric Mapping refers to the enterprise of making statistical inferences on volumetric statistic images with minimal assumptions using non-parametric statistical techniques. SnPM refers to an implementation of Statistical nonParametric Mapping by Andrew Holmes and Tom Nichols.
Getting started
First download the SnPM13 software alongside an SPM8 or SPM12b installation, ensuring SPM is on the MATLABPATH. Extract the SnPM code from the archive and copy the SnPM13 directory under toolbox in SPM. There is no need to add SnPM to the path as SnPM13 will automatically be loaded when SPM is started.
GUI usage
SnPM runs on top of the SPM Batch environment, and is loaded from within MatLab when starting SPM by typing spm fmri in the command window. This will start the SPM environment if not already done and load SnPM13 toolbox.
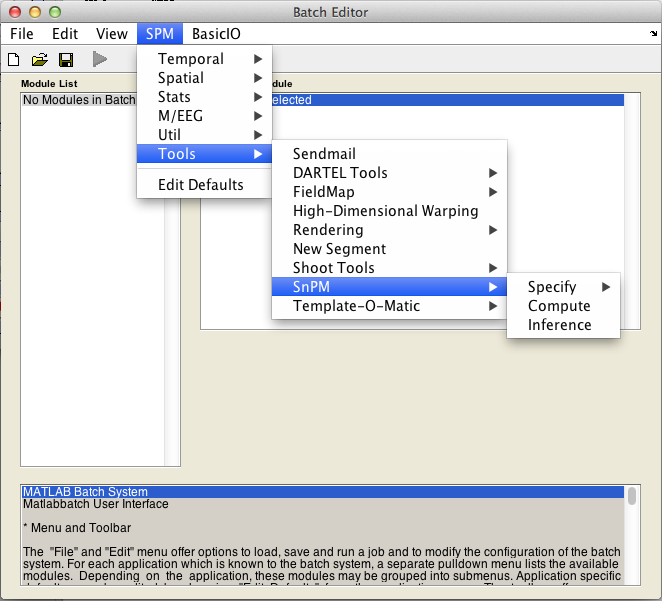
Launch SnPM13 from SPM Batch window
- Click on the
Batchbutton in SPM main window - Click on the
SnPMsub-menu in the SPM batch window, under theSPM->Toolsmenu
Batch usage
SnPM13 can also be used in batch mode using the spm_jobman function as any other SPM batch module. More info on SPM wikibooks.
Output files
Image files generated by SnPM. (SnPM, like SPM, only implements single tailed tests. In the following image files, '+' or '-' correspond to 'positive' or 'negative' effects).
- snpmT+ & snpmT-: Images of the statistic of interest (either t or pseduo-t if variance smoothing is used), positive or negative. The numbers (i.e. not NaN) saved in snpmT+ images are also saved in the SnPMt.mat file.
- lP+ & lP-: Images of -log10(uncorrected non-parametric P-values, positive or negative).
- lP_FWE+ & lP_FWE-: Images of -log10(FWE-corrected non-parametric P-values, positive or negative). Here, FWE-corrected non-parametric P-values are the proportion of the permutation distribution for the maximal statistic which exceeds the statistic image at the voxel.
- lP_FDR+ & lP_FDR-: Images of -log10(FDR-corrected non-parametric P-values, positive or negative).
- beta_**** (from 0001 to p): p images of p parameter estimates at each voxel for the correct permutation. These p parameters include all effects specified by the design matrix.
- ResMS: One image of residual mean square errors at each voxel.
Matlab files generated by SnPM.
- SnPMcfg.mat contains a collection of strings and matrices that define an analysis, created by the Configuration protion of SnPM. Note that, in contrast to SPM's SPM.mat, the configuration and results variables are separated: SnPMcfg.mat has only configuration parameters and is not altered by model fitting and the Compute step; SnPM.mat (see next) contains results information.
- SnPM.mat contains a collection of strings and matrices that pertain to the analysis. Note that there is no duplication of variables from SnPMcfg.mat; hence essential matrices (e.g. contrast & design) are in SnPMcfg.mat. Included are the number of voxels analyzed (S) and the image and voxel dimensions [V]. See
snpm_cp.mfor complete listing. - XYZ.mat contains a 3 x N matrix of the x,y and z location of the voxels in SPMF in mm (usually referring the the standard anatomical space (Talairach and Tournoux 1988)} (0,0,0) corresponds to the centre of the voxel specified by ORIGIN in the *.hdr of the original and related data.
- BETA.mat contains a p x S matrix of the p parameter estimates at each of the S voxels for the correct permutation. These parameters include all effects specified by the design matrix.
- SnPMt.mat contains a 1 x S matrix of the statistic of interest (either t or pseudo-t if variance smoothing is used) supplied for all S voxels at locations XYZ.
- SnPMucp.mat contains a 1 x S matrix of the nonparametric P values of the statistic of interest supplied for all S voxels at locations XYZ.
Neuroimaging
Statistics
Contact Info
Room D0.03
Deptment of Statistics
University of Warwick
Coventry
CV4 7AL
United Kingdom
Tel: +44(0)24 761 51086
Email: t.e.nichols 'at' warwick.ac.uk
Web: http://nisox.org
Blog: NISOx blog
![[Book Cover]](https://warwick.ac.uk/fac/sci/statistics/staff/academic-research/nichols/publications/books/handbookfmri_cover.jpg?maxWidth=125)
Handbook of fMRI Data Analysis by Russ Poldrack, Thomas Nichols and Jeanette Mumford