Data Load Metric Graphs
Overview - Work in progress
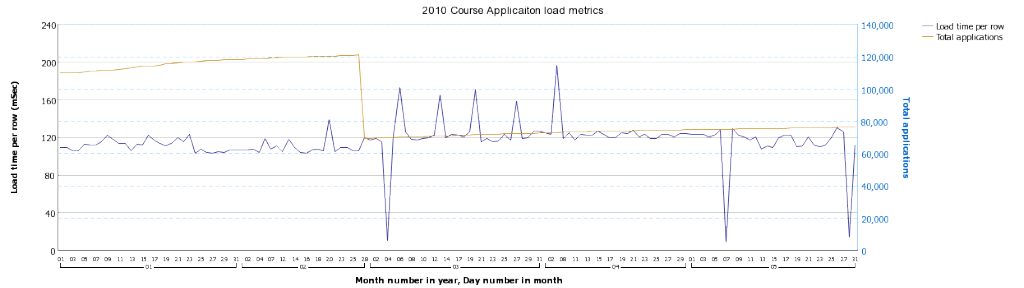
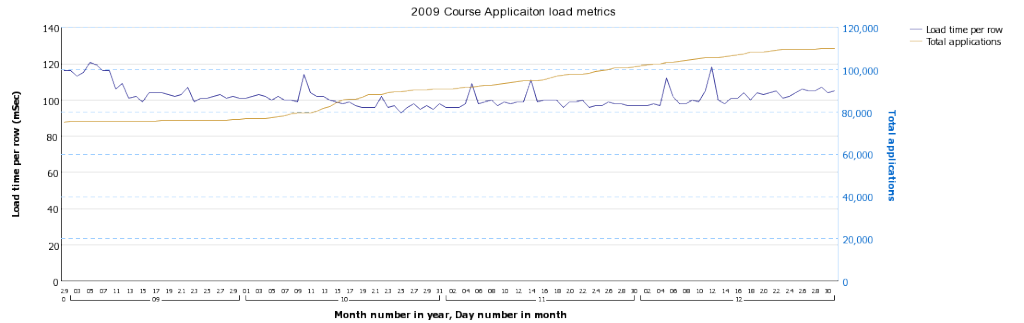
The following graphs provide insight into the performance and stability of the overnight Data load process for student applications into the data warehouse. They plot the total number of applications processed overnight and the time to process each row in milliseconds. The time to process each milliseconds will be used as the basis for a new control chart to supplement the chart of total execution time
Both measures are important but a signifcant change in the time to process each row early in the cycle would be an early warning signal of problems later in the cycle, and is more suited to control charts.
Thee charts will be updated on a monthly basis, at the end of each calendar month.
2009 Data
2010 Data