Report Metric Graphs
Overview
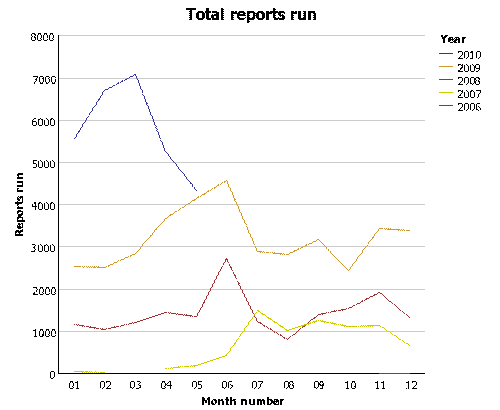
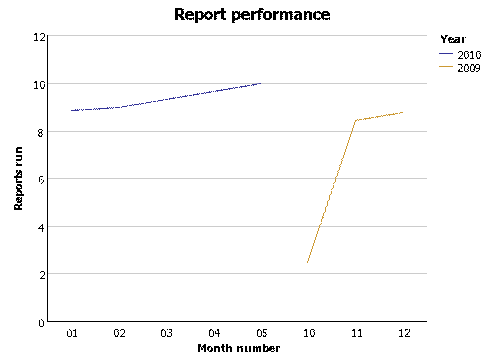
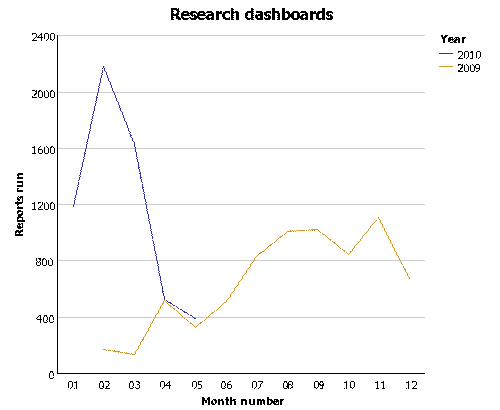
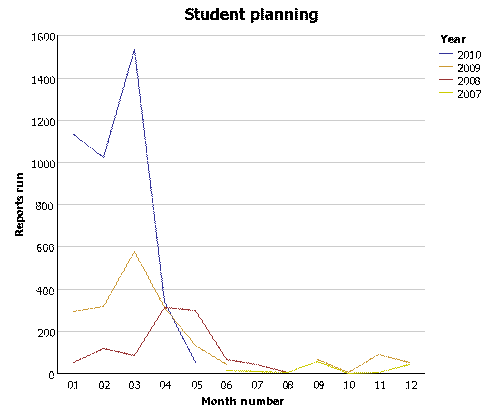
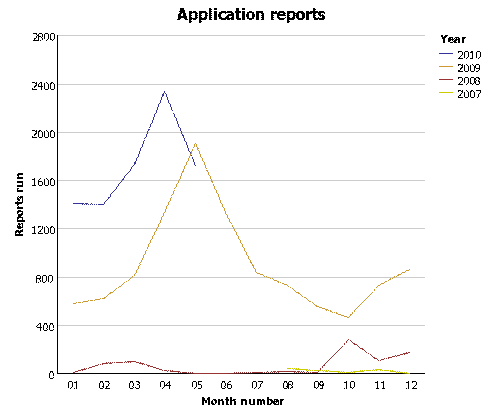
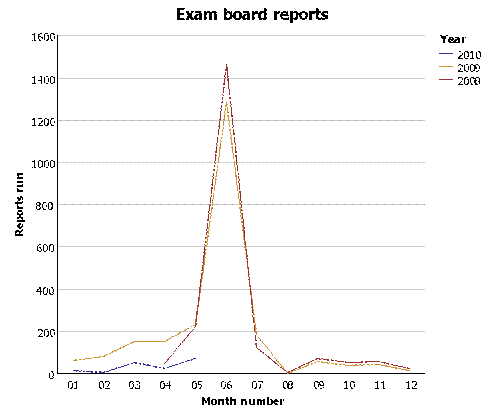
The following graphs are broad indicators of the overall activity on the Data Warehouse, broken down by business area. The monitoring reports have been excluded from the numbers ot ensure they do not skew the data.
The reports are only a broad indicator of load but they are useful for trend information and they will be updated on a monthly basis.
 |
 |
 |
 |
 |
 |
